
TEXAS' MOST SUCCESSFUL LITTER-FREE PROGRAM
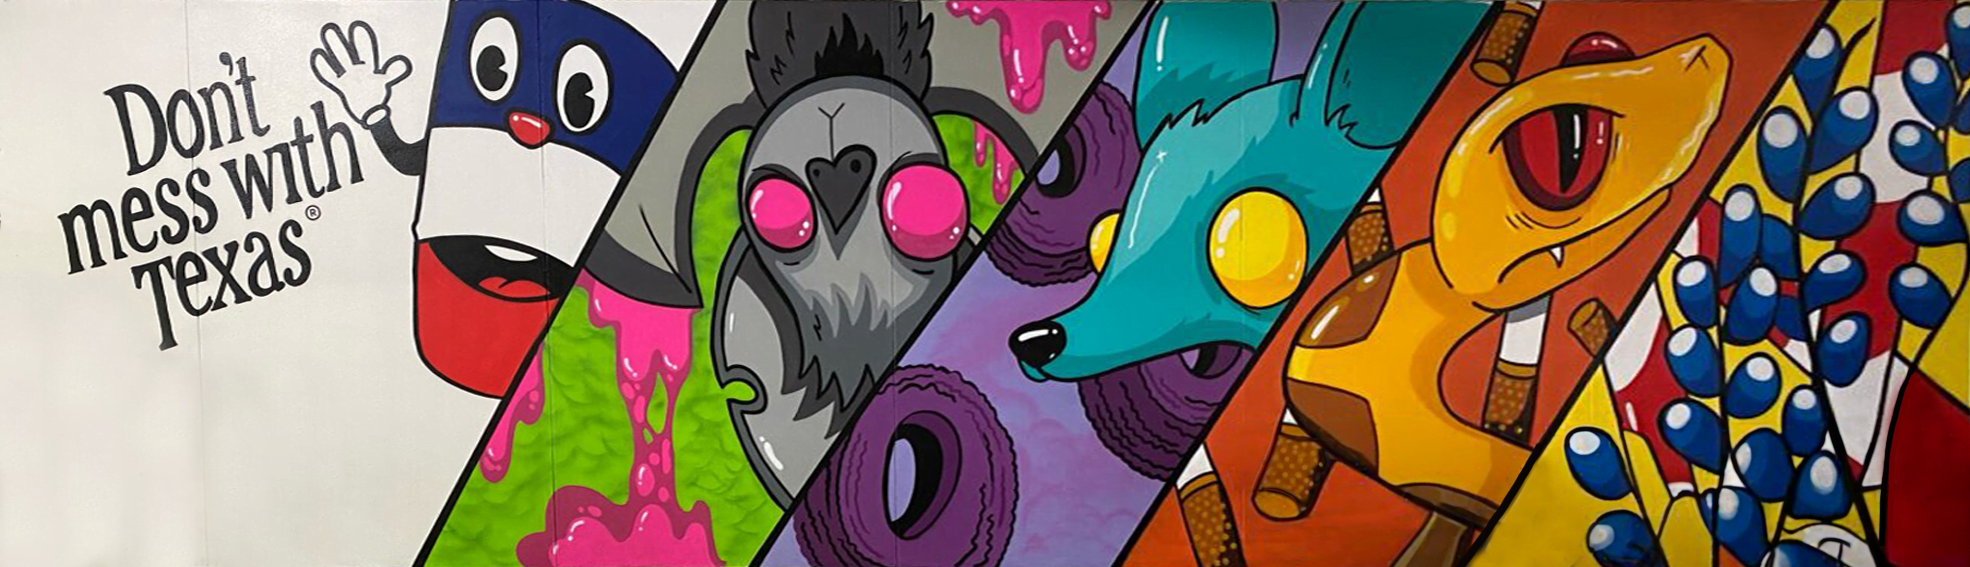
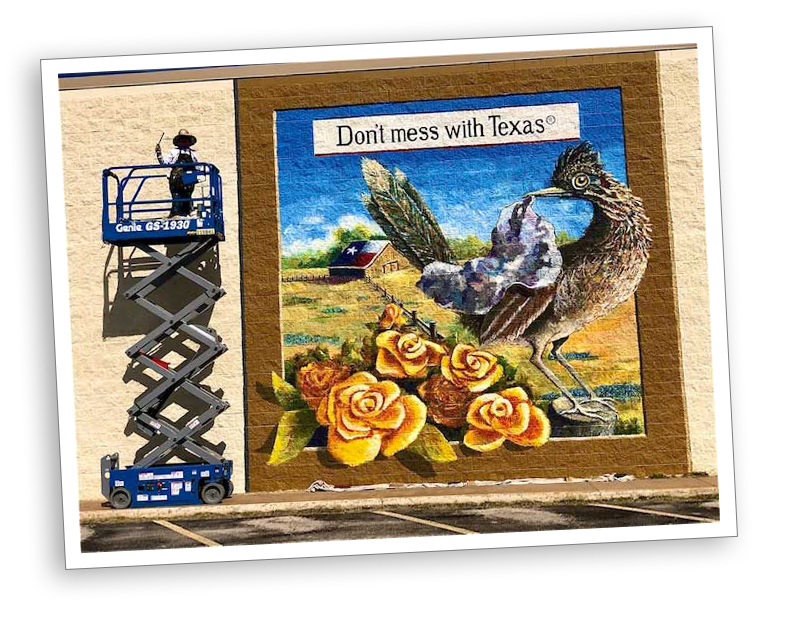
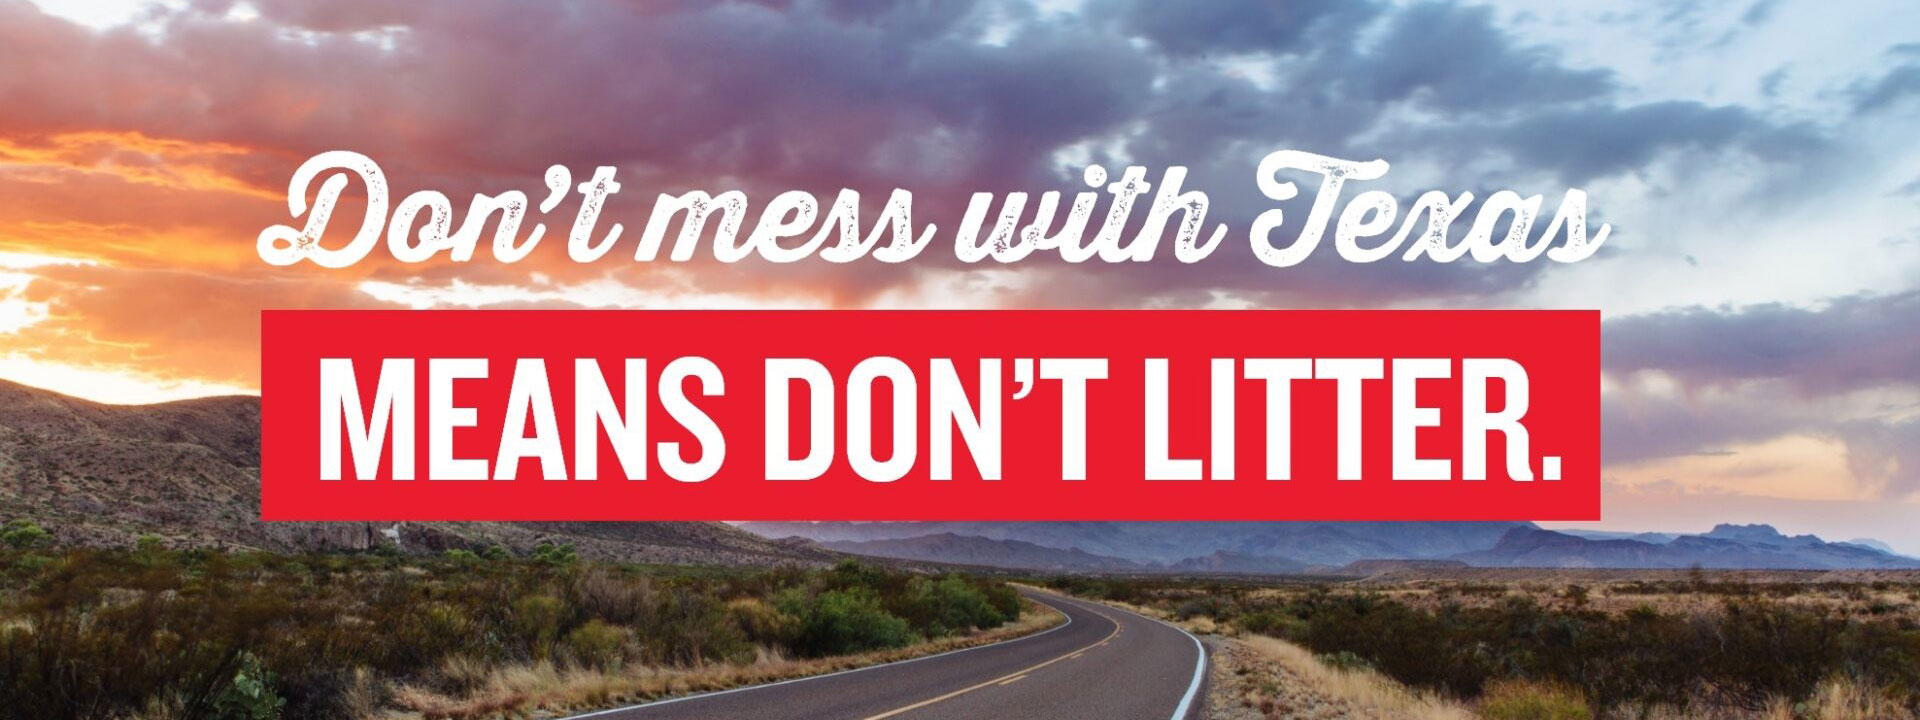
Since 1986, the Texas Department of Transportation has educated everyone that Don’t mess with Texas® means don’t litter. Through commercials, scholarships, partnerships, and trash clean-up efforts, the phrase “Don’t mess with Texas” has significantly helped reduce litter in our state. Learn more about the history of this famous and essential campaign.
ABOUT US
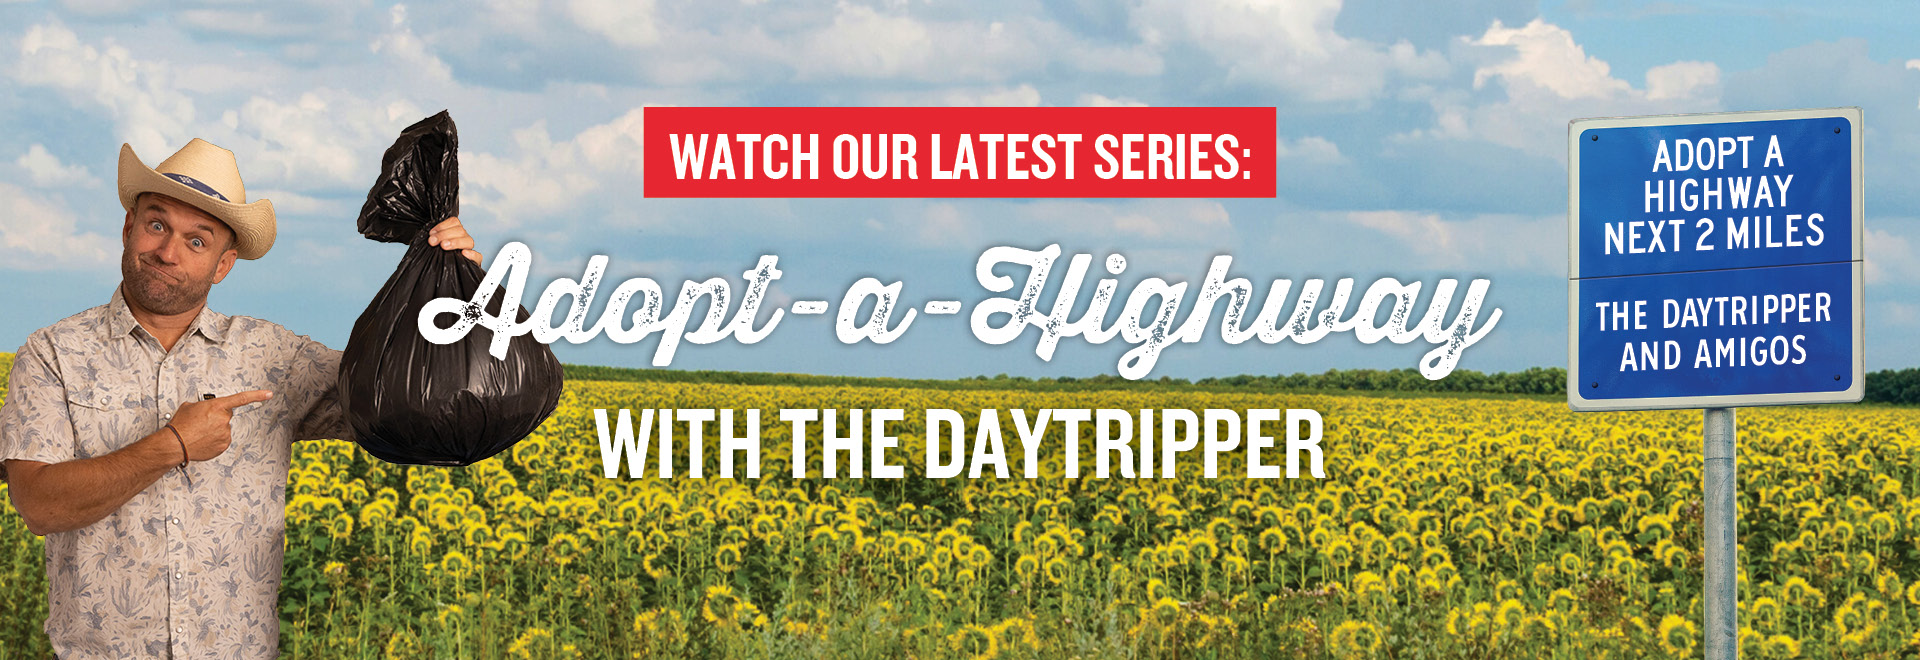
Don’t mess with Texas only works when we all work together. We need y’all to do your part and help us keep Texas clean. Luckily, there are many ways to help keep litter off our roads. Find out how you can help keep Texas litter-free.
GET INVOLVED

TEACHING TEXAS
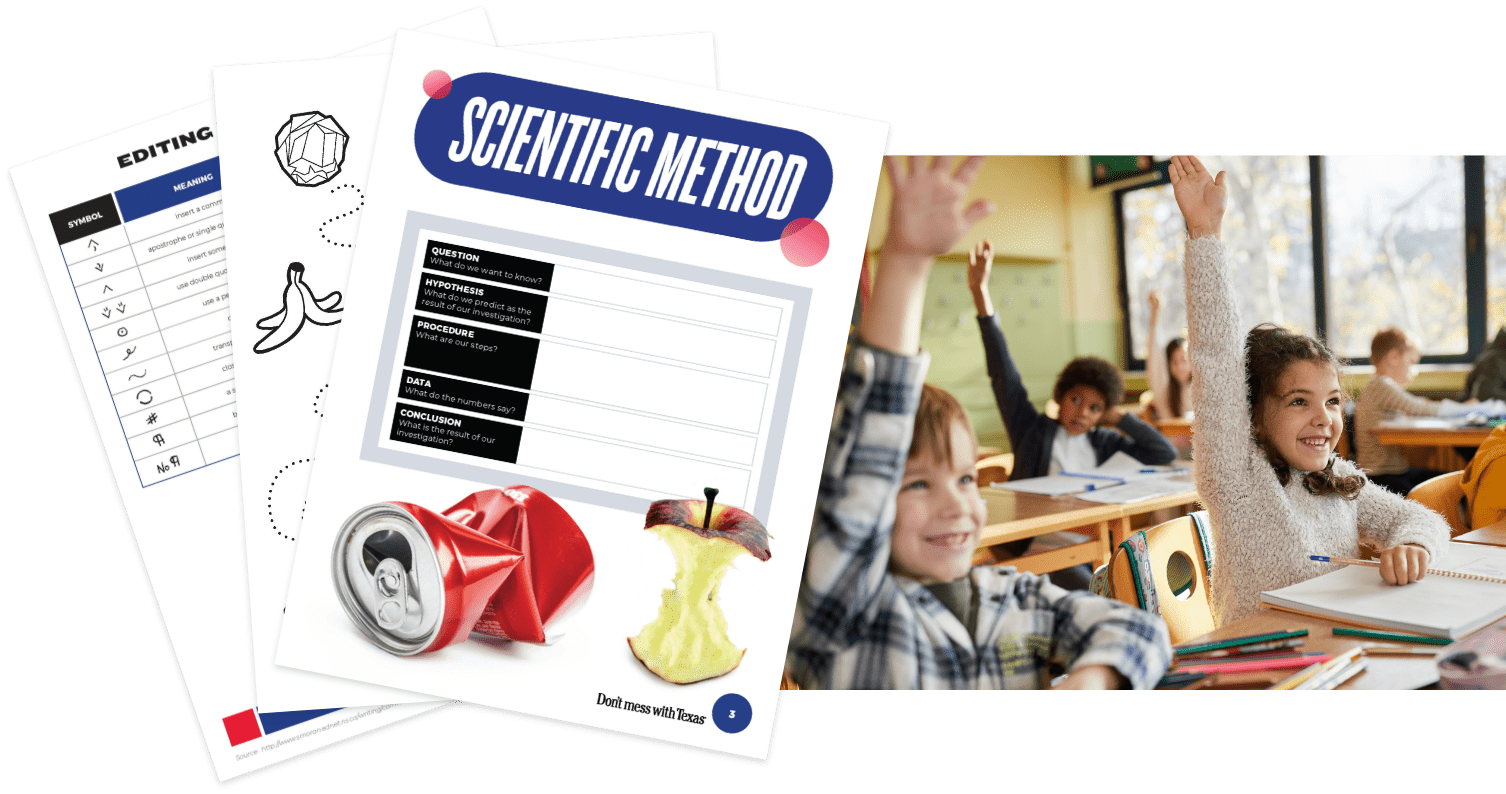
Teaching the next generation about the importance of keeping Texas clean has been a part of the Don’t mess with Texas program from the start. Now, we have more resources and facts than ever to help teach Texas students that Don’t mess with Texas means don’t litter.
EDUCATION
Have questions about the program? Take a look at our FAQ page. If you have a litter-free event that you’d like us to know about or want to learn about partnerships, feel free to reach out to us.
CONTACT US